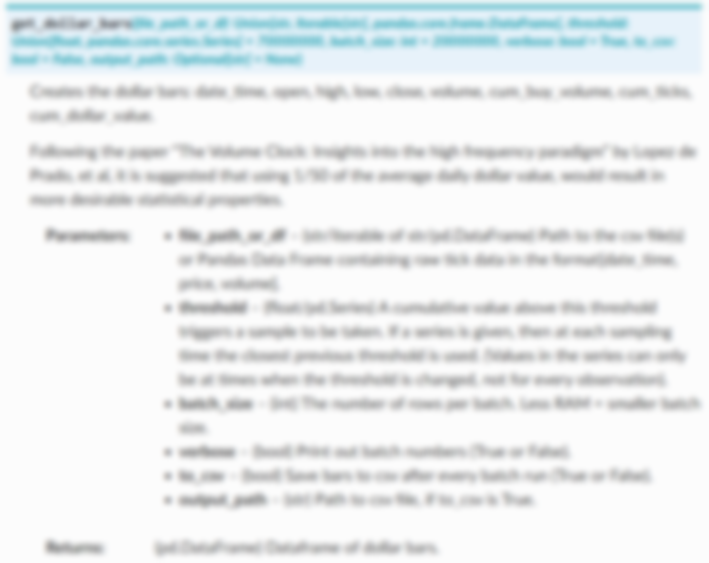
Backtest Statistics
The Backtest Statistics module contains functions related to characteristic analysis of returns and target positions. These include:
Sharpe ratios (annualised, probabilistic, deflated).
Information ratio.
Minimum Required Track Record Length.
Concentration of bets for positive and negative returns.
Drawdown & Time Under Water.
Average holding period from a series of positions.
Filtering flips and flattenings from a series of returns.
Note
Underlying Literature
The following sources elaborate extensively on the topic:
Advances in Financial Machine Learning, Chapter 14 & 15 by Marcos Lopez de Prado.
The Sharpe Ratio Efficient Frontier by David H. Bailey and Marcos Lopez de Prado. Provides a deeper understanding of Sharpe ratios implemented and Minimum track record length.
Additionally we have implemented the award winning framework by Campbell R Harvey and Yan Liu. In particular the Haircut Sharpe ratio and Profit Hurdle algorithms.
The following sources elaborate further:
Backtesting by Campbell R. Harvey and Yan Liu. The paper provides a deeper understanding of the Haircut Sharpe ratio and Profit Hurdle algorithms. The code in this module is based on the code written by the researchers.
… and the Cross-section of Expected Returns. by Harvey, C.R., Y. Liu, and H. Zhu. Describes a structural model to capture trading strategies’ underlying distribution, referred to as the HLZ model.
The Statistics of Sharpe Ratios. by Lo, A. Gives a broader understanding of Sharpe ratio adjustments to autocorrelation and different time periods
Annualized Sharpe Ratio
Calculates Annualized Sharpe Ratio for pd.Series of normal or log returns.
A usual metric of returns in relation to risk. Also takes into account number of return entries per year and risk-free rate. Risk-free rate should be given for the same period the returns are given. For example, if the input returns are observed in 3 months, the risk-free rate given should be the 3-month risk-free rate.
Calculated as:
Generally, the higher Sharpe Ratio is, the better.
Implementation
Example
An example showing how Annualized Sharpe Ratio function is used with monthly cumulative returns data:
from mlfinlab.backtest_statistics import sharpe_ratio

sr = sharpe_ratio(returns, entries_per_year=12)
Haircut Sharpe Ratio
Adjusts the Sharpe Ratio due to multiple testing.
This algorithm lets the user calculate the Sharpe ratio adjustments and the corresponding haircuts based on the key parameters of the data used in the strategy backtests. For each of the adjustment methods - Bonferroni, Holm, BHY (Benjamini, Hochberg, and Yekutieli) and the Average the algorithm calculates an adjusted p-value, haircut Sharpe ratio, and the haircut.
The haircut is the percentage difference between the original Sharpe ratio and the new Sharpe ratio.
The inputs of the method include information about the returns that were used to calculate the observed Sharpe ratio. In particular:
At what frequency were the returns observed.
The number of returns observed.
Observed Sharpe ratio.
Information on if an observed Sharpe ratio is annualized and if it’s adjusted to the autocorrelation of returns (described in the paper by Lo, A.).
Autocorrelation coefficient of returns.
The number of tests in multiple testing allowed (described in the first two papers from the introduction).
Average correlation among strategy returns.
Adjustment methods include:
Bonferroni
Holm
Benjamini, Hochberg, and Yekutieli (BHY)
Average of the methods above
The method returns np.array of adjusted p-values, adjusted Sharpe ratios, and haircuts as rows. Elements in a row are ordered by adjustment methods in the following way [Bonferroni, Holm, BHY, Average].
Haircut Sharpe Ratio algorithm consists of the following steps:
We are given the observed Sharpe ratio \(SR\) in \(T\) periods, based on this information we can calculate the p-value of a single test \(p^S\).
Assuming that \(N\) other strategies have been tried and that the average correlation of returns from the strategies is \(\rho\) , we use the HLZ model to generate \(N\) number of t-statistics from the model. We also transform the calculated \(p^S\) to a t-statistic.
This \(N+1\) t-statistics are transformed again to p-values, taking into account the data mining adjustment.
This set of \(N+1\) p-values are fed to two models described above (Holm and BHY) to get the adjusted p-values with each of the methods. (Bonferroni adjustment is calculated using only the \(p^S\) and \(N\))
The steps 2-4 are repeated multiple times (simulations).
For each of the two methods, we eventually have a set of \(p^M\) values adjusted. The median of this set is the final adjusted p-value of the method. So, we obtained p-values for each of the three methods. We then calculate the average p-value as the Average of the methods.
The obtained p-values of each method can be then transformed back to Sharpe ratios and the haircuts can be calculated.
Implementation

Probabilistic Sharpe Ratio
Calculates the probabilistic Sharpe ratio (PSR) that provides an adjusted estimate of SR, by removing the inflationary effect caused by short series with skewed and/or fat-tailed returns.
Given a user-defined benchmark Sharpe ratio and an observed Sharpe ratio, PSR estimates the probability that SR ̂is greater than a hypothetical SR.
If PSR exceeds 0.95, then SR is higher than the hypothetical (benchmark) SR at the standard significance level of 5%.
Formula for calculation:
Where:
\(SR^{*}\) - benchmark Sharpe ratio
\(SR\) - estimate od Sharpe ratio
\(Z[..]\) - cumulative distribution function (CDF) of the standard Normal distribution
\(T\) - number of observed returns
\(\gamma_3\) - skewness of the returns
\(\gamma_4\) - kurtosis of the returns
Implementation
Example
An example showing how Probabilistic Sharpe Ratio function is used with an example of data with normal returns:

Deflated Sharpe Ratio
Calculates the deflated Sharpe ratio (DSR) - a PSR where the rejection threshold is adjusted to reflect the multiplicity of trials. DSR is estimated as PSR[SR∗], where the benchmark Sharpe ratio, SR∗, is no longer user-defined, but calculated from SR estimate trails.
DSR corrects SR for inflationary effects caused by non-Normal returns, track record length, and multiple testing/selection bias.
Given a user-defined benchmark Sharpe ratio and an observed Sharpe estimates (or their properties - standard deviations and number of trails), DSR estimates the probability that SR is greater than a hypothetical SR. Allows the output of the hypothetical (benchmark) SR.
If DSR exceeds 0.95, then SR is higher than the hypothetical (benchmark) SR at the standard significance level of 5%.
Hypothetical SR is calculated as:
Where:
\(SR^{*}\) - benchmark Sharpe ratio
\(\{SR_{n}\}\) - trails of SR estimates
\(Z[..]\) - cumulative distribution function (CDF) of the standard Normal distribution
\(N\) - number of SR trails
\(\gamma\) - Euler-Mascheroni constant
\(e\) - Euler constant
Implementation
Example
An example showing how Deflated Sharpe Ratio function with list of SR estimates as well as properties of SR estimates and benchmark output:
Information Ratio
Calculates Annualized Information Ratio for a given pandas Series of normal or log returns.
It is the annualized ratio between the average excess return and the tracking error. The excess return is measured as the portfolio’s return in excess of the benchmark’s return. The tracking error is estimated as the standard deviation of the excess returns.
Benchmark should be provided as a return for the same time period as that between input returns. For example, for the daily observations it should be the benchmark of daily returns.
Calculated as:
Implementation

Example
An example showing how Annualized Information Ratio function is used with monthly cumulative returns data:
Profit Hurdle
This algorithm calculates the Required Mean Return of a strategy at a given level of significance adjusted due to multiple testing.
The method described below works only with characteristics of monthly returns that have no autocorrelation.
The inputs of the method include information about returns data. In particular:
The number of tests in multiple testing allowed (described in the first two papers from the introduction).
Number of monthly returns observed.
Significance level.
Annual return volatility.
Average correlation among strategy returns.
Adjustment methods include:
Bonferroni
Holm
Benjamini, Hochberg, and Yekutieli (BHY)
Average of the methods above
Profit Hurdle algorithm consists of the following steps:
We are given the significance level \(p\), strategy volatility \(\sigma\), the number of observations \(T\) , and the number of tests that have been concluded \(T\) .
Using the HLZ model, we generate \(N\) t-statistics assuming that the average correlation of returns is \(\rho\) .
Using two methods (Holm and BHY) we calculate the threshold t-statistic that matches the \(p\) significance level.
The steps 2-3 are repeated multiple times (simulations).
For the two methods (Holm and BHY) we have a set of t-statistics. We then take the median of t-statistics in each set and call it a t-statistic for the method. T-ststistic for Bonferroni is calculated based on \(p\) and \(N\), as in the previous algorithm (Haircut Sharpe Ratios).
The obtained t-statistics of each method can be then transformed to mean monthly returns. We then calculate the average mean monthly return as the Average of the methods returns.
Implementation
The method returns np.array of minimum average monthly returns by the method as elements. The order of the elements by method is [Bonferroni, Holm, BHY, Average].
Minimum Track Record Length
Calculates the Minimum Track Record Length - “How long should a track record be in order to have statistical confidence that its Sharpe ratio is above a given threshold?”
If a track record is shorter than MinTRL, we do not have enough confidence that the observed Sharpe ratio ̂is above the designated Sharpe ratio threshold.
MinTRLis expressed in terms of number of observations, not annual or calendar terms.
Minimum Track Record Length is calculated as:
Where:
\(SR^{*}\) - benchmark Sharpe ratio
\(SR\) - estimate od Sharpe ratio
\(Z_{\alpha}\) - Z score of desired significance level
\(\gamma_3\) - skewness of the returns
\(\gamma_4\) - kurtosis of the returns
Implementation
Example
An example showing how Minimum Track Record Length function is used with an example of data with normal returns:
Bets Concentration
Concentration of returns measures the uniformity of returns from bets. Metric is inspired by Herfindahl-Hirschman Index and is calculated as follows:
The closer the concentration is to 0, the more uniform the distribution of returns (When 0, returns are uniform). If the concentration value is close to 1, returns highly concentrated (When 1, only one non-zero return).
Returns \(nan\) if less than 3 returns in series.
Implementation
All Bets Concentration
Concentration of returns measures the uniformity of returns from bets. Metric is inspired by Herfindahl-Hirschman Index and is calculated as follows:
The closer the concentration is to 0, the more uniform the distribution of returns (When 0, returns are uniform). If the concentration is close to 1, returns highly concentrated (When 1, only one non-zero return).
This function calculates concentration separately for positive returns, negative returns and concentration of bets grouped by time intervals (daily, monthly etc.) separately.
If concentration of positive returns is low, there is no right fat tail in returns distribution.
If concentration of negative returns is low, there is no left fat tail in returns distribution.
If after time grouping is less than 2 observations, returns third element as nan.
Implementation
Drawdown and Time Under Water
Intuitively, a drawdown is the maximum loss suffered by an investment between two consecutive high-watermarks.
The time under water is the time elapsed between a high watermark and the moment the PnL (profit and loss) exceeds the previous maximum PnL.
Input a series of cumulated returns, or account balance. Can be in dollars or other currency, then the function returns the respective drawdowns.
The function returns two series:
Drawdown series index is time of a high watermark and the drawdown value.
Time under water index is time of a high watermark and how much time passed till next high watermark is reached, in years. Also includes time between the last high watermark and last observation in returns as the last Time under water element. Without this element the estimations of Time under water can be biased.
Implementation
Example
An example showing how Drawdown and Time Under Water function is used with account data in dollars:
Average Holding Period
Parameters of the algorithm are calculated as follows:
When the size of the position is increasing
Updating EntryTime - time when a trade was opened, adjusted by increases in positions. This takes into account the weight of the position increase.
When the size of a bet is decreasing.
Capturing the \(HoldingTime = (EntryTime - CurrentTime)\) as well as \(Weight\) of the closed position. If entire position is closed, setting \(EntryTime\) to \(CurrentTime\).
Finally, calculating, using values captured in step 2.
If no closed trades in the series, output is \(nan\)
Implementation
Example
Flattening and Flips
Points of Flipping: When target position changes sign (For example, changing from 1.5 (long position) to -0.5 (short position) on the next timestamp)
Points of Flattening: When target position changes from nonzero to zero (For example, changing from 1.5 (long position) to 0 (no positions) on the next timestamp)
Implementation
Research Notebooks
The following research notebooks can be used to better understand how the statistics within this module can be used on real data.

Presentation Slides

Note
pg 14-26: Backtesting Methods

Note
pg 1-17: Backtesting Statistics
pg 18-38: Type I and Type II Errors
pg 39-44: Understanding Strategy Risk
pg 47-73: Deep dive into the Sharpe Ratio