Directional Change
The Directional Change module contains functions and classes related to the detection of general price movement and feature generation based on direction split. It is planned to later build a Regime Change module on top of Directional Change tools.
- These include:
signal
total_price_movement
time_for_completion
time_adjusted_return
Note
Underlying Literature
Detecting Regime Change in Computational Finance by Jun Chen & Edward P K Tsang
Directional Changes: A New Way to Look at Price Dynamics by Edward P K Tsang
Is Directional Change
Directional Change (DC) is a metric which samples data points at their peaks and troughs in their movement. Price movements are defined by two types of events: Directional Change (DC) Event and Overshoot (OS) Event. With a pre-defined Threshold, every price curve can be dissected by these two components.
The value of the threshold needs to be pre-defined by the observer. It represents how big of a price change the observer considers as significant.
A DC Event will be confirmed when the price change reaches the threshold. A DC Event is not usually immediately followed by an opposite DC Event, but by an OS Event. An OS Event records the price movement from one DC Event to the next.
Price movements are partitioned into uptrend and downtrend. When the price changes from Point A to Point B, the price change reaches a threshold \(\theta\), then a DC Event is confirmed. Point A is then considered as an Extreme point (EXT). And Point B is considered as a Directional Change Confirmation (DCC) point. Similarly, the next DC Event is confirmed at Point D. The price movement between two DC Events is considered an OS Event (from Point B to C).
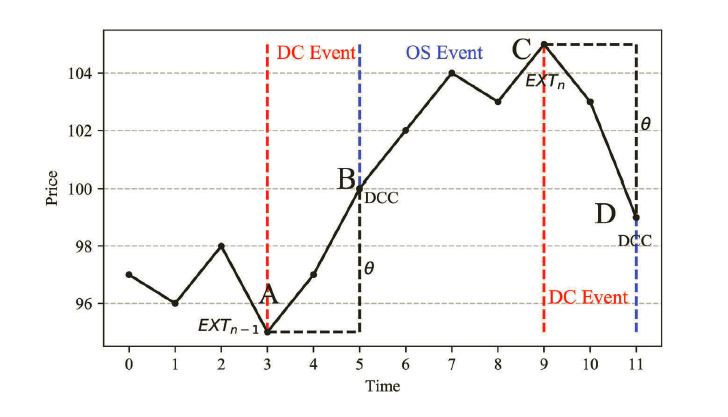
Figure 1: Directional Change Event. (Jun Chen & Edward P K Tsang 2020)
Example
Total Price Movement
This indicator measures the absolute percentage of the price change in a trend. As shown in Figure 1, Total Price Movement (TMV) is used to measure the percentage change from Point A to Point C, normalized by the threshold. It usually measures the total price change of a DC event and an OS event. It is defined as:
Implementation
Example
Time for Completion
This indicator measures the amount of the physical time (T) that it takes to complete a TMV trend. As shown in Figure 1, it measures the time from Time 3 to Time 9. It is defined as:
where \(t_{EXT}(n)\) represents the time at \(n-th\) extreme point.
Implementation
Example
Time Adjusted Return
This indicator measures the absolute return (R) in a trend. It is calculated by dividing the absolute TMV by the time interval T. It measures the percentage of price change per time unit:
where \(R(n)\) represents the value of the time-adjusted return of DC at the \(n-th\) extreme point.
Implementation
Example