Fixed Horizon
Fixed horizon labels is a classification labeling technique used in the following paper: Dixon, M., Klabjan, D. and Bang, J., 2016. Classification-based Financial Markets Prediction using Deep Neural Networks.
Note
Based on our industry experience, we would say this is by far the most popular technique for labeling data in financial machine learning.
Despite its numerous criticisms, this remains the go to choice for many practitioners. See Triple Barrier Labeling for an alternative approach.
Fixed time horizon is a common method used in labeling financial data, usually applied on time bars. The rate of return relative to \(t_0\) over time horizon \(h\), assuming that returns are lagged, is calculated as follows (M.L. de Prado, Advances in Financial Machine Learning, 2018):
Where \(t_1\) is the time bar index after a fixed horizon has passed, and \(p_{t0}, p_{t1}\) are prices at times \(t_0, t_1\). This method assigns a label based on comparison of rate of return to a threshold \(\tau\)
To avoid overlapping return windows, rather than specifying \(h\), the user is given the option of resampling the returns to get the desired return period. Possible inputs for the resample period can be found here.. Optionally, returns can be standardized by scaling by the mean and standard deviation of a rolling window. If threshold is a pd.Series, threshold.index and prices.index must match; otherwise labels will fail to be returned. If resampling is used, the threshold must match the index of prices after resampling. This is to avoid the user being forced to manually fill in thresholds.
The following shows the distribution of labels for standardized returns on closing prices of SPY in the time period from Jan 2008 to July 2016 using a 20-day rolling window for the standard deviation.
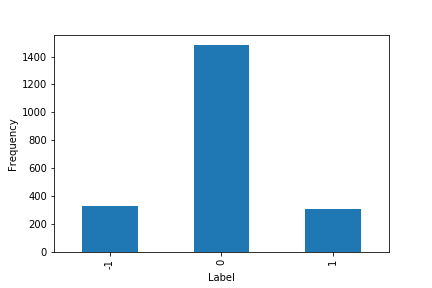
Distribution of labels on standardized returns on closing prices of SPY.
Though time bars are the most common format for financial data, there can be potential problems with over-reliance on time bars. Time bars exhibit high seasonality, as trading behavior may be quite different at the open or close versus midday; thus it will not be informative to apply the same threshold on a non-uniform distribution. Solutions include applying the fixed horizon method to tick or volume bars instead of time bars, using data sampled at the same time every day (e.g. closing prices) or inputting a dynamic threshold as a pd.Series corresponding to the timestamps in the dataset. However, the fixed horizon method will always fail to capture information about the path of the prices [Lopez de Prado, 2018].
Note
Underlying Literature
The following sources describe this method in more detail:
Advances in Financial Machine Learning, Chapter 3.2 by Marcos Lopez de Prado.
Machine Learning for Asset Managers, Chapter 5.2 by Marcos Lopez de Prado.
Classification-based Financial Markets Prediction using Deep Neural Networks by Dixon, M., Klabjan, D. and Bang, J.
Implementation
Research Notebook
The following research notebook can be used to better understand the Fixed Horizon labeling technique.