Note
The following implementation and documentation closely follow the work of Gautier Marti: CorrGAN: Sampling Realistic Financial Correlation Matrices using Generative Adversarial Networks.
And the work of Donnat, P., Marti, G. and Very, P: Toward a generic representation of random variables for machine learning.
Data Verification
Data verification for synthetic data is needed to confirm if it shares some properties of the original data. Being able to examine and validate synthetically generated data is critical to building more accurate systems. Without verification, we would operate on data that might not have any significance in the real world. We present several methods to examine the properties of this type of data.
Note
Underlying Literature
The following sources elaborate extensively on the topic:
CorrGAN: Sampling Realistic Financial Correlation Matrices using Generative Adversarial Networks by Gautier Marti.
Toward a generic representation of random variables for machine learning by Donnat, P., Marti, G. and Very, P.
Stylized Factors of Correlation Matrices
Following the work of Gautier Marti in CorrGAN, we provide function to plot and verify a synthetic matrix has the 6 stylized facts of empirical correlation matrices.
The stylized facts are:
Distribution of pairwise correlations is significantly shifted to the positive.
Eigenvalues follow the Marchenko-Pastur distribution, but for a very large first eigenvalue (the market).
Eigenvalues follow the Marchenko-Pastur distribution, but for a couple of other large eigenvalues (industries).
Perron-Frobenius property (first eigenvector has positive entries).
Hierarchical structure of correlations.
Scale-free property of the corresponding Minimum Spanning Tree (MST).
Example
Time Series Codependence Visualization
Note
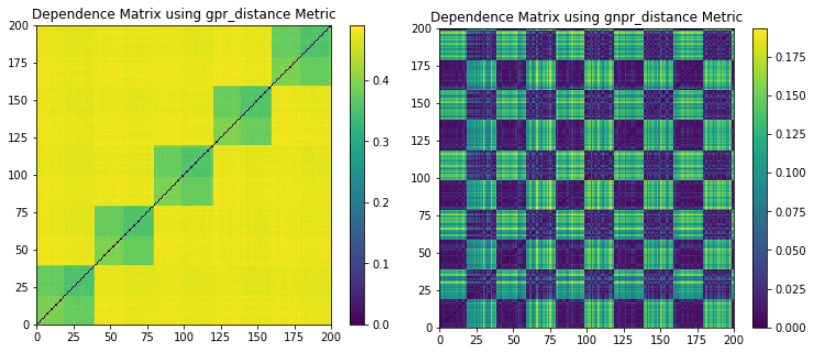
The correlated random walks time series generation and GNPR codependence measure approaches are fully explored in our Correlated Random Walks and Codependence by Marti sections.
Following the work of Donnat, Marti, and Very (2016) we provide a method to plot the GNPR codependence matrix and visualize the different underlying distributions these time series may have. GNPR was shown to detect all underlying distributions more accurately than other methods, as it L2 distance, correlation distance, and GPR.
Implementation
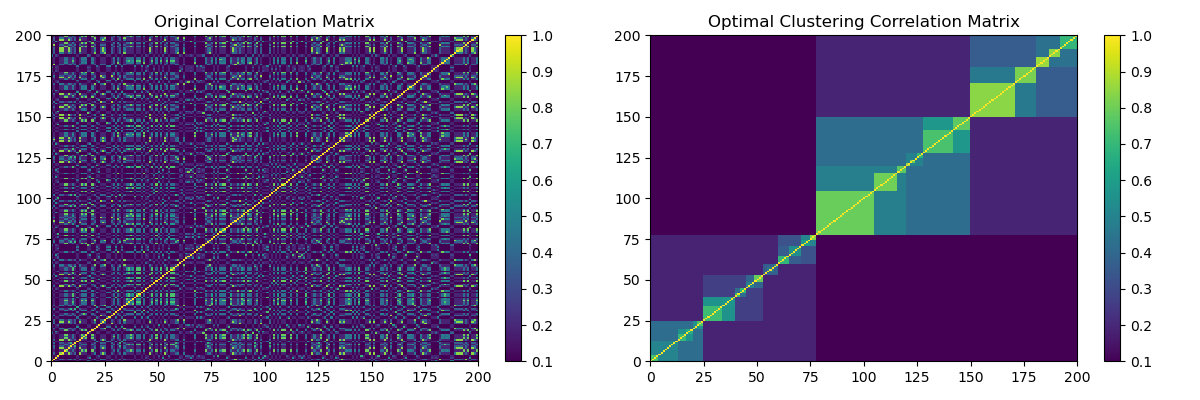
Optimal Hierarchical Clustering
This function plots the optimal leaf hierarchical clustering as shown in Marti, G. (2020) TF 2.0 DCGAN for 100x100 financial correlation matrices by arranging a matrix with hierarchical clustering by maximizing the sum of the similarities between adjacent leaves.
Implementation