Standard Bars
When analyzing financial data, unstructured data sets, in this case tick data, are commonly transformed into a structured format referred to as bars, where a bar represents a row in a table. MlFinLab implements tick, volume, and dollar bars using traditional standard bar methods as well as the less common information driven bars.
For those new to the topic, it is discussed in the graduate level textbook: Advances in Financial Machine Learning, Chapter 2.
Note
Underlying Literature
The following sources elaborate extensively on the topic:
Advances in Financial Machine Learning, Chapter 2 by Marcos Lopez de Prado.
The four standard bar methods implemented share a similar underlying idea in that they take a sample of data after a certain threshold is reached and they all result in a time series of Open, High, Low, and Close data.
Time bars, are sampled after a fixed interval of time has passed.
Tick bars, are sampled after a fixed number of ticks have taken place.
Volume bars, are sampled after a fixed number of contracts (volume) has been traded.
Dollar bars, are sampled after a fixed monetary amount has been traded.
These bars are used throughout the text book (Advances in Financial Machine Learning, By Marcos Lopez de Prado, 2018, pg 25) to build the more interesting features for predicting financial time series data.
Tip
A fundamental paper that you need to read to have a better grasp on these concepts is: Easley, David, Marcos M. López de Prado, and Maureen O’Hara. “The volume clock: Insights into the high-frequency paradigm.” The Journal of Portfolio Management 39.1 (2012): 19-29.
Tip
A threshold can be either fixed (given as float) or dynamic (given as pd.Series). If a dynamic threshold is used
then there is no need to declare threshold for every observation. Values are needed only for the first observation
(or any time before it) and later at times when the threshold is changed to a new value.
Whenever sampling is made, the most recent threshold level is used.
An example for volume bars We have daily observations of prices and volumes:
Time |
Price |
Volume |
|---|---|---|
20.04.2020 |
1000 |
10 |
21.04.2020 |
990 |
10 |
22.04.2020 |
1000 |
20 |
23.04.2020 |
1100 |
10 |
24.04.2020 |
1000 |
10 |
And we set a dynamic threshold:
Time |
Threshold |
|---|---|
20.04.2020 |
20 |
23.04.2020 |
10 |
The data will be sampled as follows:
20.04.2020 and 21.04.2020 into one bar, as their volume is 20.
22.04.2020 as a single bar, as its volume is 20.
23.04.2020 as a single bar, as it now fills the lower volume threshold of 10.
24.04.2020 as a single bar again.
Time Bars
These are the traditional open, high, low, close bars that traders are used to seeing. The problem with using this sampling technique is that information doesn’t arrive to market in a chronological clock, i.e. news events don’t occur on the hour - every hour.
It is for this reason that Time Bars have poor statistical properties in comparison to the other sampling techniques.
Example
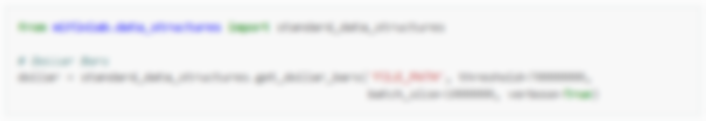
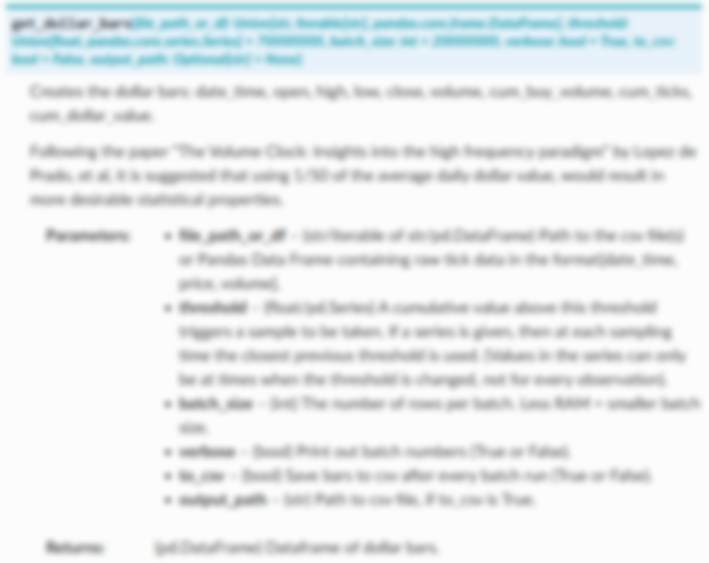
Dollar Bars
Tip
Dollar bars are the most stable of the 4 types.
It is suggested that using 1/50 of the average daily dollar value, would result in more desirable statistical properties
Example
Statistical Properties
The chart below shows that tick, volume, and dollar bars all exhibit a distribution significantly closer to normal - versus standard time bars:
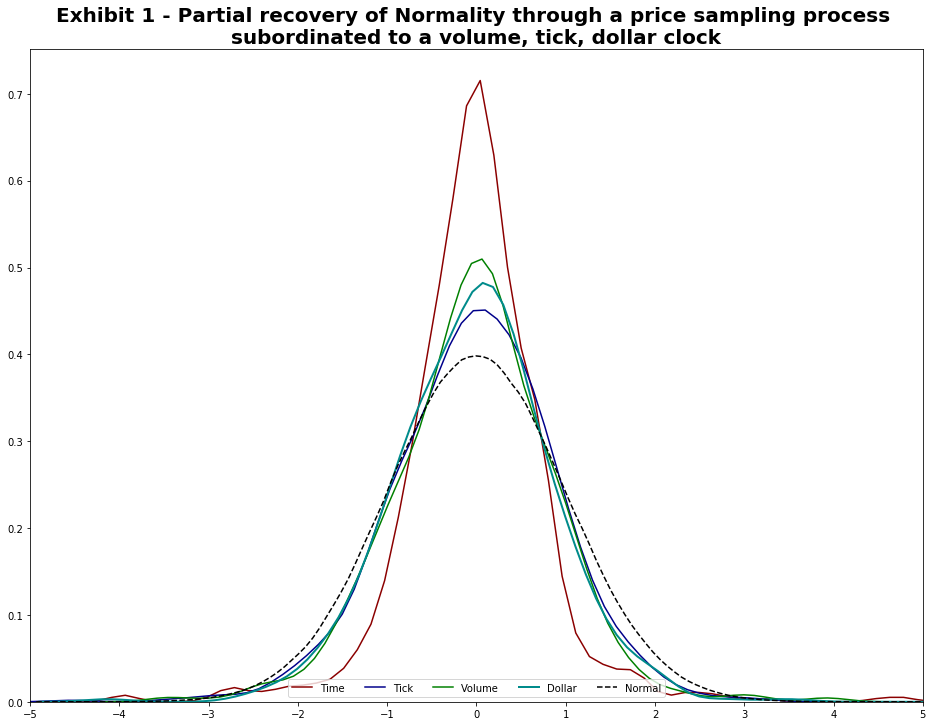
This matches up with the results of the original paper “The volume clock (2012)”.
Research Notebooks
The following research notebooks can be used to better understand the previously discussed data structures.