Tail Sets
Tail set labels are a classification labeling technique introduced in the following paper: Nonlinear support vector machines can systematically identify stocks with high and low future returns, by Huerta, R., Corbacho, F. and Elkan, C.
A tail set is defined to be a group of assets whose return is in the highest or lowest quantile, for example the highest or lowest 5%, for a given timestamp. The returns may be volatility-adjusted.
A classification model is then fit using these labels to determine which stocks to buy and sell, for a long / short portfolio.
We label the y variable using the tail set labeling technique, which makes up the positive and negative (1, -1) classes of the training data. The original paper investigates the performance of 3 types of metrics on which the tail sets are built:
Real returns
Residual alpha after regression on the sector index
Volatility-adjusted returns
For our particular implementation, we have focused on the volatility-adjusted returns.
Metric: Volatility-Adjusted Returns
The formula for the volatility-adjusted returns are as follows:
Where \(R(t-t',t)\) is the return for the asset, in our case we make use of daily (single period) returns, and \(vol(t-1)\) is a measure for volatility on daily returns. We provide two implementations for estimations of volatility, first the exponential moving average of the mean absolute returns, and second the traditional standard deviation. (The paper suggests a 180 day window period.)
To quote the paper: “Huffman and Moll (2011) show that risk measured as the mean absolute deviation has more explanatory power for future expected returns than standard deviation.”
Creating Tail Sets
Once the volatility adjusted returns have been applied to the DataFrame of prices we then loop over each timestamp and group the assets into quantiles. The user inputs the number of quantiles desired using the n_bins input, and the highest and lowest quantiles compose positive and negative tail sets, respectively. For example, if the highest and lowest octile are desired, then n_bins would be 8.
Its important to note that we drop the 0 labels (for a given timestamp) and only train the model assets that made it into the tail sets.
The following figure from the paper shows the distribution of the 91-day volatility-adjusted returns for the industrials sector.
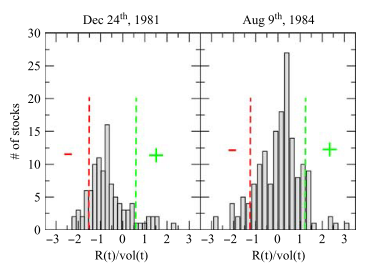
The positive tail sets are the 10% most positive volatility-adjusted returns, and the negative tail sets are the 10% most negative. The vertical dotted lines represent the decile cut. The + and − regions are the ones used for model training.
How to use these labels in practice?
The tail set labels from the code above returns the names of the assets which should be labeled with a positive or negative label. Its important to note that the model you would develop is a many to one model, in that it has many x variables and only one y variable. The model is a binary classifier.
The model is trained on the training data and then used to score every security in the test data (on a given day). Example: On December 1st 2019, the strategy needs to rebalance its positions, we score all 100 securities in our tradable universe and then rank the outputs in a top down fashion. We form a long / short portfolio by going long the top 10 stocks and short the bottom 10 (equally weighted). We then hold the position to the next rebalance date.
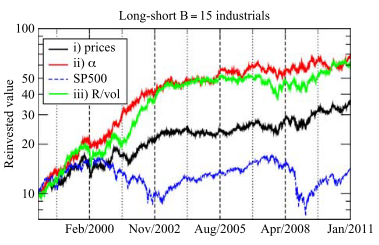
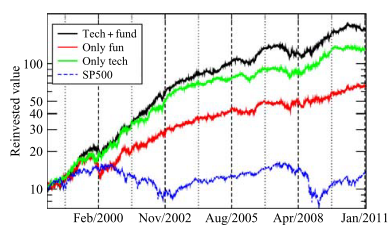
The paper provides the following investment performance:
Implementation
Warning
The Tail Set labels are for the current day! In order to use them as a labeling technique you need to lag them so that
they can be forward looking. We recommend using the pandas DataFrames df.lag(1) method.
Research Notebook
The following research notebooks can be used to better understand the Tail Set labeling technique.