Note
The following implementation and documentation is based on the works of Daniel Lewandowski, Dorota Kurowicka, and Harry Joe: Generating random correlation matrices based on vines and extended onion method and Generating random correlation matrices based partial correlations.
Vine and Extended Onion Methods
Note
Underlying Literature
The following sources elaborate extensively on the topic:
Generating random correlation matrices based on vines and extended onion method by Lewandowski, D., Kurowicka, D. and Joe, H.
Generating random correlation matrices based partial correlations by Harry Joe.
Robust dependence modeling for high-dimensional covariance matrices with financial applications by Harry Joe.
Behavior of the NORTA method for correlated random vector generation as the dimension increases by Ghosh, S. and Henderson, S.G.
Vines
A vine is a graphical tool for modeling dependence structures of high-dimensional probability distributions. Copulas are multivariate distributions with uniform univariate margins. It examines the association or dependence between many variables.
Vines have been proven to be useful and flexible tools in high-dimensional correlation structure modeling. They consist of a nested set of connected trees where the edges in one tree are the nodes of another tree, and the edges of that tree are the nodes of a third tree and so on.
According to Zhu and Welsch (2018), they are defined as:
\(V\) is an R-vine on \(p\) elements with \(E(V) = E_1 \cup ... \cup E_{p-1}\) denoting a set of edges of \(V\) if:
\(V = {T_1, ..., T_{p-1}}\)
\(T_1\) is a connected tree with nodes \(N_1 = {1, ..., p}\), and edges \(E_1\)
For \(i = 2, ..., p-1\); \(T_i\) is a tree with nodes \(N_i = E_{i-1}\)
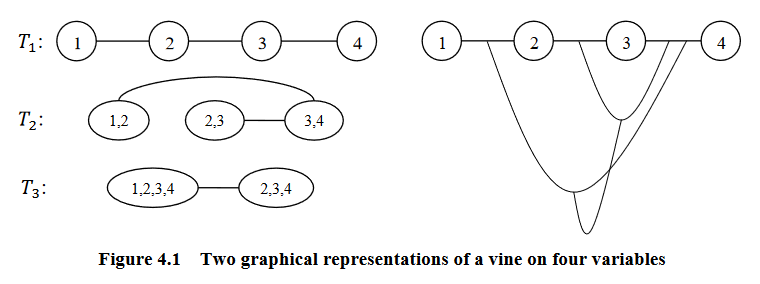
Graphical representation of a vine (courtesy of Zhu and Welsch (2018)).
The most common vine structures are regular vines (R-vines,) canonical vine (C-vines,) and drawable vines (D-vines). The following examples are based on the work of to Zhu and Welsch (2018).
R-Vines
A vine is considered a regular vine on \(p\) elements with \(E(V) = E_1 \cup ... \cup E_{p-1}\) denoting the set of edges of \(V\) if:
\(V\) is a vine
For \(i = 2, ..., p-1\); \({a, b} \in E_i\); \(\#(a \Delta b) = 2\). Where \(\Delta\) denotes the symmetric difference operator, and \(\#\) denotes the cardinality of a set. Therefore, \(a \Delta b = (a \cup b) \setminus (a \cap b)\)
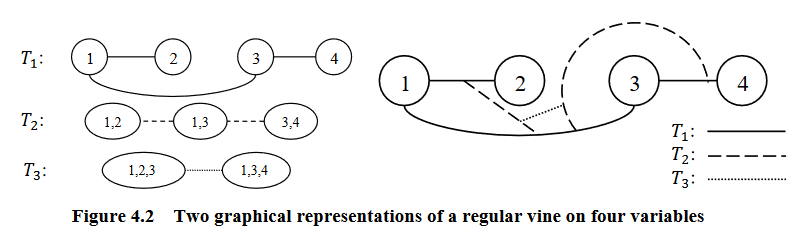
Graphical representation of an R-vine (courtesy of Zhu and Welsch (2018)).
C-Vines
An R-vine is considered a C-vine if each tree \(T_i\) has a unique node of degree \(p-i\) for \(i = 1, ..., p-2\).
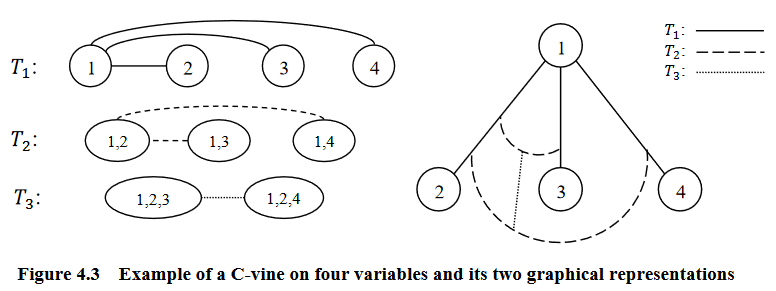
Graphical representation of an C-vine (courtesy of Zhu and Welsch (2018)).
D-Vines
An R-vine is considered a D-vine if each node in \(T_1\) has a degree of at most 2.
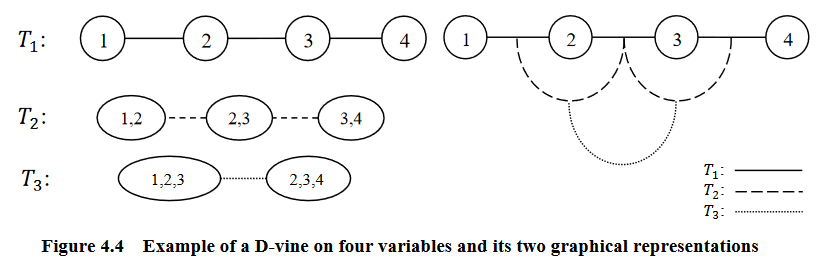
Graphical representation of an D-vine (courtesy of Zhu and Welsch (2018)).
Partial Correlation Vines
Partial correlation measures the degree of association between two random variables while controlling for a third random variable. It is used to find the variance between two variables while eliminating the variance from the third variable.
A partial correlation vine can be formed with an R-vine, C-vine, or D-vine structure \(V\). Each edge of the vine is identified with a partial correlation coefficient. Thus each edge in \(V\) has can have a value in [-1, 1]. \(V\) specifies \({d \choose 2}\) standard and partial correlations.
Correlation Matrices Generation
In his work, Joe shows that by using a D-vine, we can generate a \(d\)-dimensional random positive definite correlation matrix \(R = (\rho_{i, j})\) by choosing independent distributions \(F_{i, j}, 1 \leq i < j \leq d\), for these \({d \choose 2}\) parameters. \(F_{i, j}\) conditions are chosen so that the joint density of \((\rho_{i, j})\) is proportional to a power of \(det(R)\).
Joe goes on to prove one can generate \(\frac{d \cdot (d-1)}{2}\) partial correlations by independently sampling from a beta distribution of different densities, transformed to the range [-1, 1] and then convert them into raw correlations via a recursive formula. The resulting matrix will be distributed uniformly. The partial correlations can be generated using the D-vine or C-vine methods.
When using the D-vine, the beta distribution \(Beta(\alpha_i, \alpha_i)\) is sampled for \(\alpha_1 = d/2, ..., \alpha_{d-2}, \alpha_{d-1}\) Where
\(\alpha_{d-2} = \alpha_{d-3} - 1/2\)
\(\alpha_{d-1} = \alpha_{d-2} - 1/2\)
Lewandowski, Kurowicka, and Joe extended this method for the C-vine. They introduce the paramater \(\eta\) to sample from a distribution proportional to \(det(R)^{\eta-1}\). The resulting beta distribution \(Beta(\alpha_i, \alpha_i)\) is sampled for \(\alpha_1 = \eta+ (d-1)/2, ..., \alpha_{d-2}, \alpha_{d-1}\) Where
\(\alpha_{d-2} = \alpha_{d-3} - 1/2\)
\(\alpha_{d-1} = \alpha_{d-2} - 1/2\)
The Onion Method
The onion method as described by Ghosh and Henderson (2003) is a method to sample exactly and quickly from a uniform distribution. It iteratively creates a correlation matrix by starting with a one-dimensional matrix. Then it ‘grows out’ the matrix by adding one dimension at a time. Lewandowski, Kurowicka, and Joe modified this method and named it the extended onion method. The extend onion samples correlation matrices from a distribution proportional to \(det(R)^{\eta-1}\) as described above. It samples exactly from the uniform distribution over the set of correlation matrices on the surface of a k-dimensional hypersphere, a subset of \(R^{\frac{d-1}{1}}\).
The onion method is based on the fact that any correlation matrix of size \((k+1) \times (k+1)\) can be partitioned as
Where \(\textbf{r}_k\) is an \(k \times k\) correlation matrix and \(\textbf{z}\) is a \(k\)-vector of correlations.
Implementation
Example
Here we show the correlation matrix generated for each method.
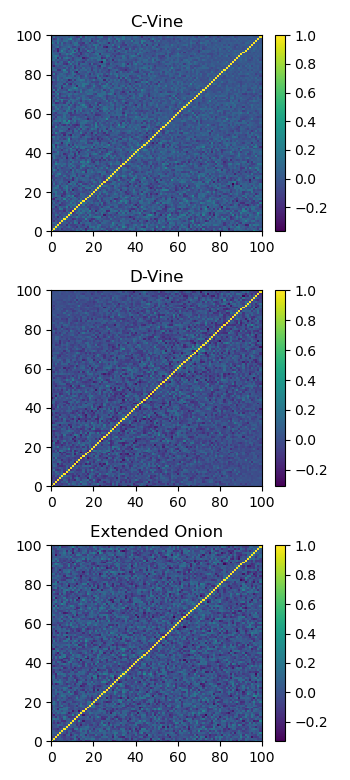
Plot of a sample generated correlation matrix using each method.
We show that by biasing the beta distribution from which the C-vine and D-vine methods sample their correlations, we can generate stronger correlations matrices. For a beta distribution \(Beta(\alpha, \beta)\), if \(\alpha \gg \beta\), the resulting correlation matrix has stronger positive correlations. If \(\alpha \ll \beta\), the resulting correlation matrix has stronger negative correlations.
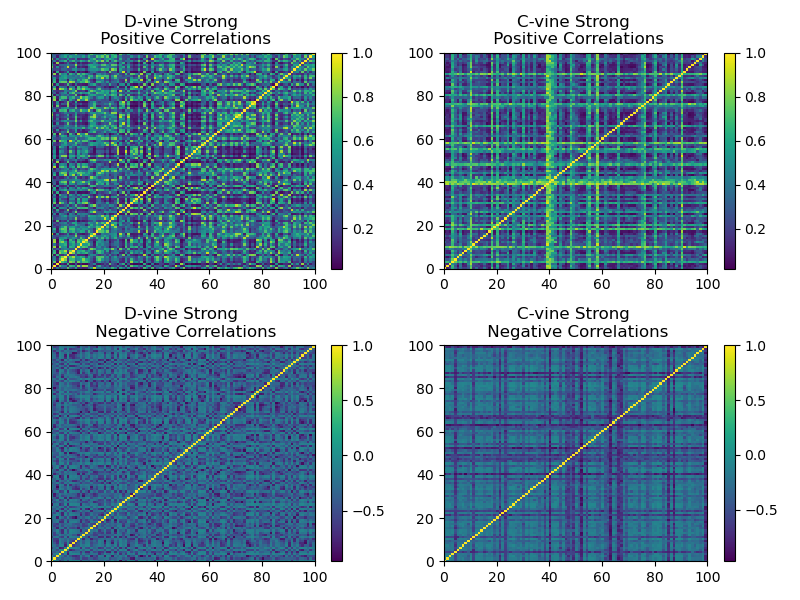
Plot of a sample generated correlation matrix using skewed beta distributions for stronger correlations.
Research Notebook
The following research notebook can be used to better understand the Vines and Extended Onion methods.