Introduction
Note
Underlying Literature
The following sources describe this method in more detail:
A review of two decades of correlations, hierarchies, networks and clustering in financial markets by Marti, G., Nielsen, F., Bińkowski, M. and Donnat, P.
Networks
Networks module creates beautiful and informative visualizations of financial data, using network theory to describe complex systems such as financial markets.
Networks takes in a codependence or distance matrix between a set of elements and converts it into graphs such as a Minimum Spanning Tree, creating a mini Flask server using Plotly’s Dash to display the interactive graphs.
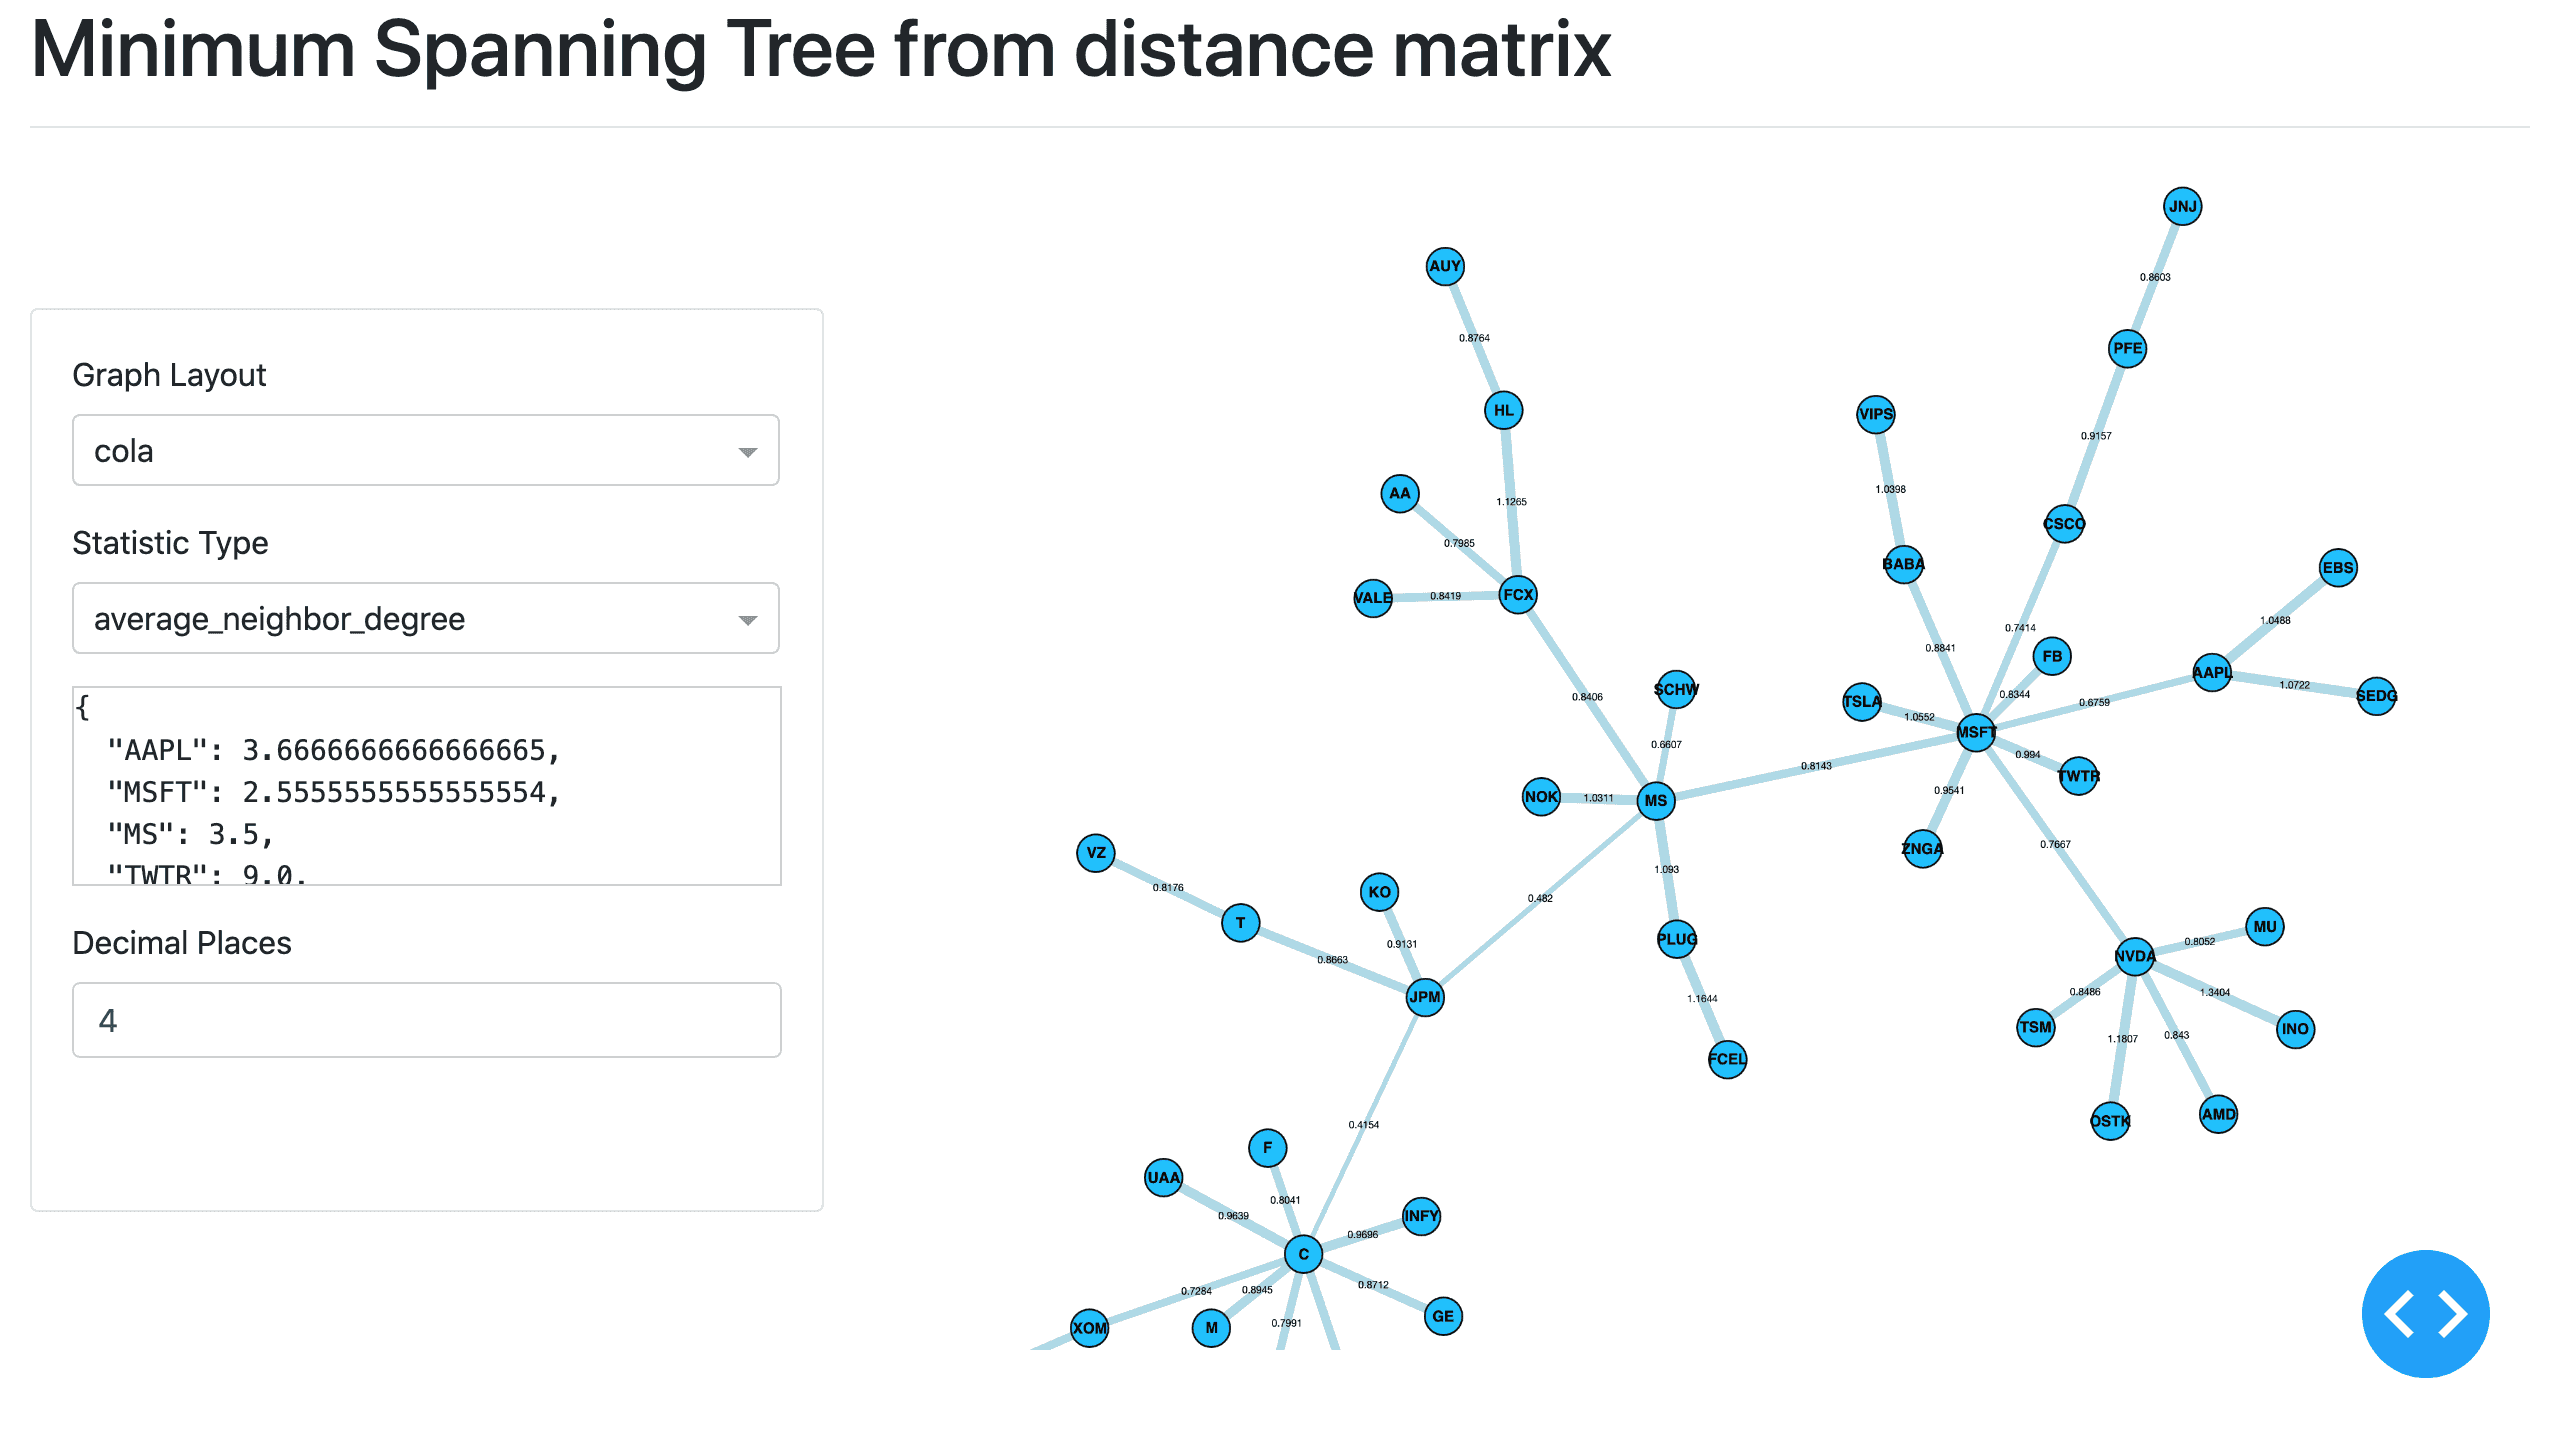
Interactive Minimum Spanning Tree graph of 48 stocks based on daily closing price data from 15th August 2017 - 10th of August 2020
Four aspects of network visualisation tools have been added:
Minimum Spanning Tree (MST).
Average Linkage Minimum Spanning Tree (ALMST).
Planar Maximally Filtered Graph (PMFG).
Triangulated Maximally Filtered Graph (in development).
The methods from the visualisations.py file can be used to create visualisations given a dataframe of log returns.
Input Matrices
Methods take distance or correlation matrices as inputs. Tools to calculate various codependences and distances can be found in the Codependence module. To create a matrix from a set of observations, the Codependence Matrix function can be used.
Correlation Matrix
Let \(n\) be the number of assets, \(P_i(t)\) be price \(t\) of asset \(i\) and \(r_i(t)\) be the log-return at time \(t\) of asset \(i\):
For each pair of assets \(i\), \(j\) of assets, compute their correlation:
Distance Matrix
Having followed the steps to create a correlation matrix, convert the correlation coefficients \(\rho_{ij}\) into distances:
For a more detailed explanation, please refer to Correlation-Based Metrics section, as it describes the measures in more detail.